What Polysomnography Actually Is
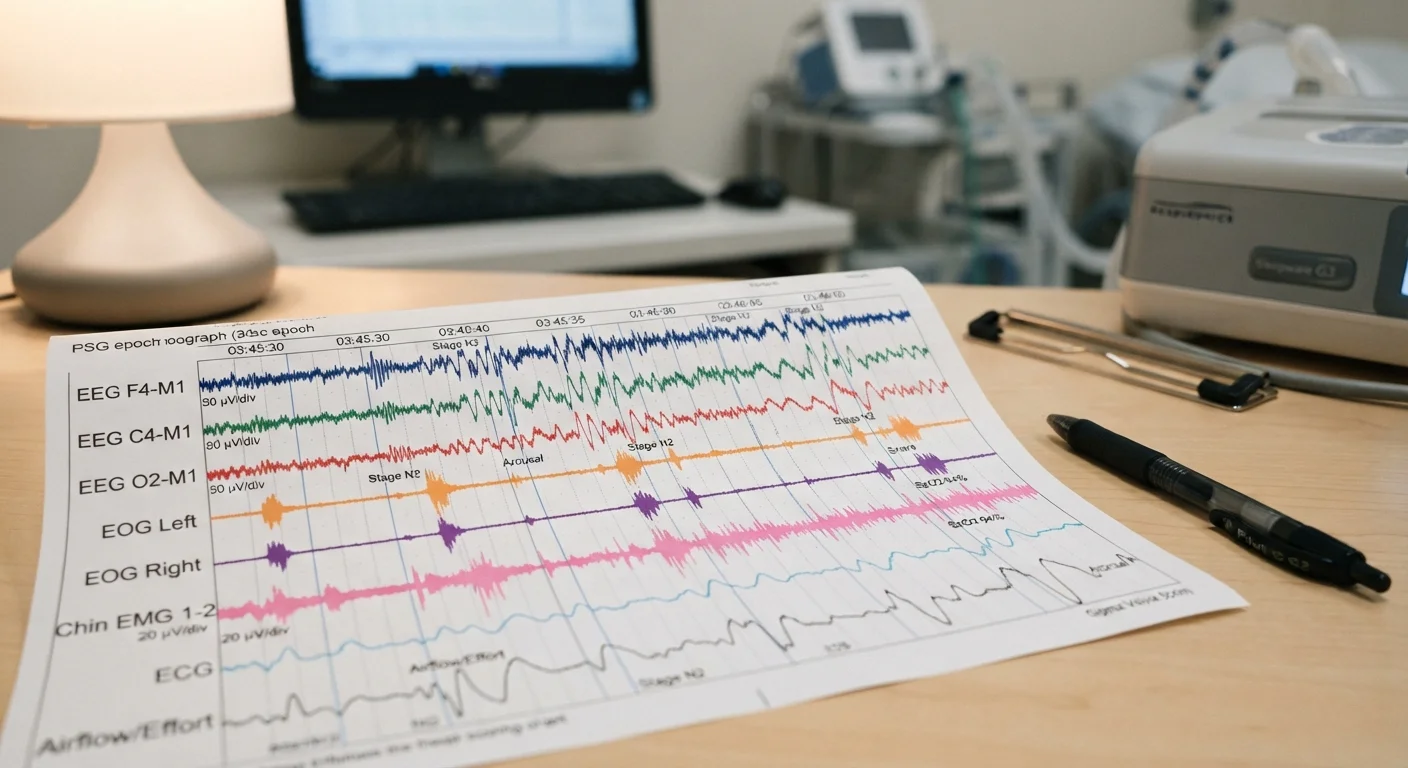
Polysomnography (PSG) is the clinical gold standard for evaluating sleep. The word breaks down simply: poly (many) + somno (sleep) + graphy (recording). During an overnight study, electrodes and sensors continuously capture multiple physiological channels at once — brain electrical activity, eye movements, muscle tone, airflow, chest and abdominal effort, blood oxygen saturation, heart rhythm, and limb movement.
That simultaneous, multi-channel design is what makes PSG uniquely powerful. A wearable fitness tracker infers sleep stages from motion and heart rate. PSG measures them directly at the neural and physiological level. For a deeper grounding in why sleep staging matters biologically, see our guide to sleep architecture.
Studies are most commonly conducted in an accredited sleep laboratory, though home sleep apnea tests (HSATs) use a simplified subset of sensors for specific clinical questions. Full in-lab PSG remains the reference standard when the diagnostic picture is complex.
What you will need
How the Night's Data Gets Turned into a Report
Raw PSG produces hours of continuous signal. A registered sleep technologist — and increasingly, validated automated software reviewed by a technologist — scores the recording in 30-second segments called epochs. Each epoch is assigned a single stage: Wake, N1, N2, N3, or REM, following the American Academy of Sleep Medicine (AASM) scoring rules.
Stage assignment relies primarily on the electroencephalogram (EEG). N1 shows low-amplitude, mixed-frequency activity as the brain exits wakefulness. N2 is characterized by sleep spindles (bursts of 12–15 Hz activity) and K-complexes (sharp, high-amplitude waveforms). N3 — slow-wave or deep sleep — is defined by high-amplitude delta waves occupying at least 20% of the epoch. REM sleep is identified by low-amplitude mixed-frequency EEG combined with the near-complete suppression of muscle tone on the chin EMG and the characteristic rapid eye movements on the EOG channels.
Once every epoch is scored, software compiles the hypnogram — a timeline graph that maps stage progression across the entire night. From that hypnogram, all the summary statistics in your report are calculated. If you're newer to how these stages function, Sleep Science From the Ground Up covers the core biology.
Reading the Key Numbers in Your Report
Most PSG reports organize findings into three broad areas: sleep architecture, respiratory events, and movement or arousal data. Here is what the most clinically significant metrics mean:
- Total Sleep Time (TST): The actual number of minutes spent in any sleep stage, excluding time awake in bed.
- Sleep Efficiency: TST divided by time in bed, expressed as a percentage. Values above 85% are generally considered within normal range in adults, though this benchmark should be interpreted alongside clinical context.
- Sleep Architecture: The percentage of TST spent in each stage. Broadly, N2 accounts for roughly 45–55% in healthy adults, N3 for 15–25%, and REM for 20–25%, though these norms shift with age.
- Sleep Latency: Minutes from lights-out to the first epoch of sleep. Consistently prolonged latency may warrant clinical attention.
- REM Latency: Time from sleep onset to the first REM epoch. Normal is roughly 90 minutes. Very short REM latency can be a marker of certain conditions, including narcolepsy or depression.
- Apnea-Hypopnea Index (AHI): The average number of apneas (complete breathing pauses) plus hypopneas (partial obstructions with desaturation or arousal) per hour of sleep. An AHI below 5 is generally normal in adults; 5–14 indicates mild obstructive sleep apnea (OSA); 15–29 moderate; 30 or above severe.
- Oxygen Desaturation Index (ODI) and SpO₂ nadir: How often oxygen drops by 3–4% per hour, and the single lowest oxygen level recorded. Sustained desaturation below 88–90% carries clinical significance.
- Arousal Index: Brief EEG disruptions per hour that fragment sleep without full awakening. Elevated arousal index — even without conscious awareness — correlates with daytime impairment.
- Periodic Limb Movement Index (PLMI): Repetitive leg movements per hour; a PLMI above 15, particularly when linked to arousals, may indicate Periodic Limb Movement Disorder.
Consumer Trackers vs. Clinical PSG
Wearable devices estimate sleep stages using motion and heart rate variability — useful for broad trends but not clinically equivalent to EEG-based scoring. Studies have found that consumer trackers tend to overestimate total sleep time and show variable accuracy for individual stage identification, particularly for N3 and N1. PSG remains the reference standard when clinical decisions depend on accurate staging data.
For context on how consumer devices compare, Tracking Your Sleep: What the Data Can and Cannot Tell You provides an honest comparison of wearable accuracy versus clinical measurement.
This article is for general informational and educational purposes only and does not constitute medical advice. Consult a qualified healthcare provider to interpret your own sleep study results and for guidance on any sleep-related condition or treatment.